Top 5 High-Accuracy Chart Patterns
A focused collection of the most reliable cryptocurrency chart patterns with detailed trading strategies
Some say technical analysis and chart patterns is like Astrology, but for men. Well, they are not wrong. Technical analysis, chart patterns, and fractals are basically make-do-believe kind of thing. It reflects the psychology and decision making of every single market participant. It transform the chaos of the market, into a structured data. These patterns represent the psychological battles between buyers and sellers in the market. It is by no mean a tool to predict the future, but you could pretty much use it to guide your decision making. This curated library focuses on the five most reliable patterns that have proven effective in cryptocurrency trading.
1. Swing Fail Pattern (SFP/Deviation)

Swing Fail Pattern (SFP)
A powerful pattern where price briefly breaks a significant support/resistance level but quickly reverses, trapping traders who entered on the breakout.
Now this is my bread and butter in trading futures, there's even traders out there doing their business solely with this pattern. It is arguably one of the most effective and accurate pattern with very easy invalidation.
The example chart was taken from AVAX chart back in 2022. You could clearly see the candle breaking above resistance for a moment and rejected back into the range. The follow up of the rejection is nothing but cinematic.
Formation Criteria:
- Identify a clear support or resistance level that has been tested multiple times
- Price briefly breaks through this level (Trap the breakout traders)
- Price quickly reverses and moves back beyond the level in the opposite direction (Deviation)
- Volume often increases during the reversal phase
Trading Strategy:
- Entry: Enter after confirmation of the reversal (price moving back through the original level)
- Stop Loss: Place slightly beyond the extreme point of the deviation
- Take Profit: Target the previous swing high/low in the opposite direction, or use a risk-reward ratio of at least 1:2
Key Points:
- Stronger when occurring at major liquidity areas or after extended trends
- Often represents smart money triggering stop losses before reversing the market
- Look for volume confirmation during the reversal phase
- Can work on all timeframes, but more reliable on higher timeframes (4H+)
2. Double Top/Bottom Pattern
Double Top/Bottom Pattern
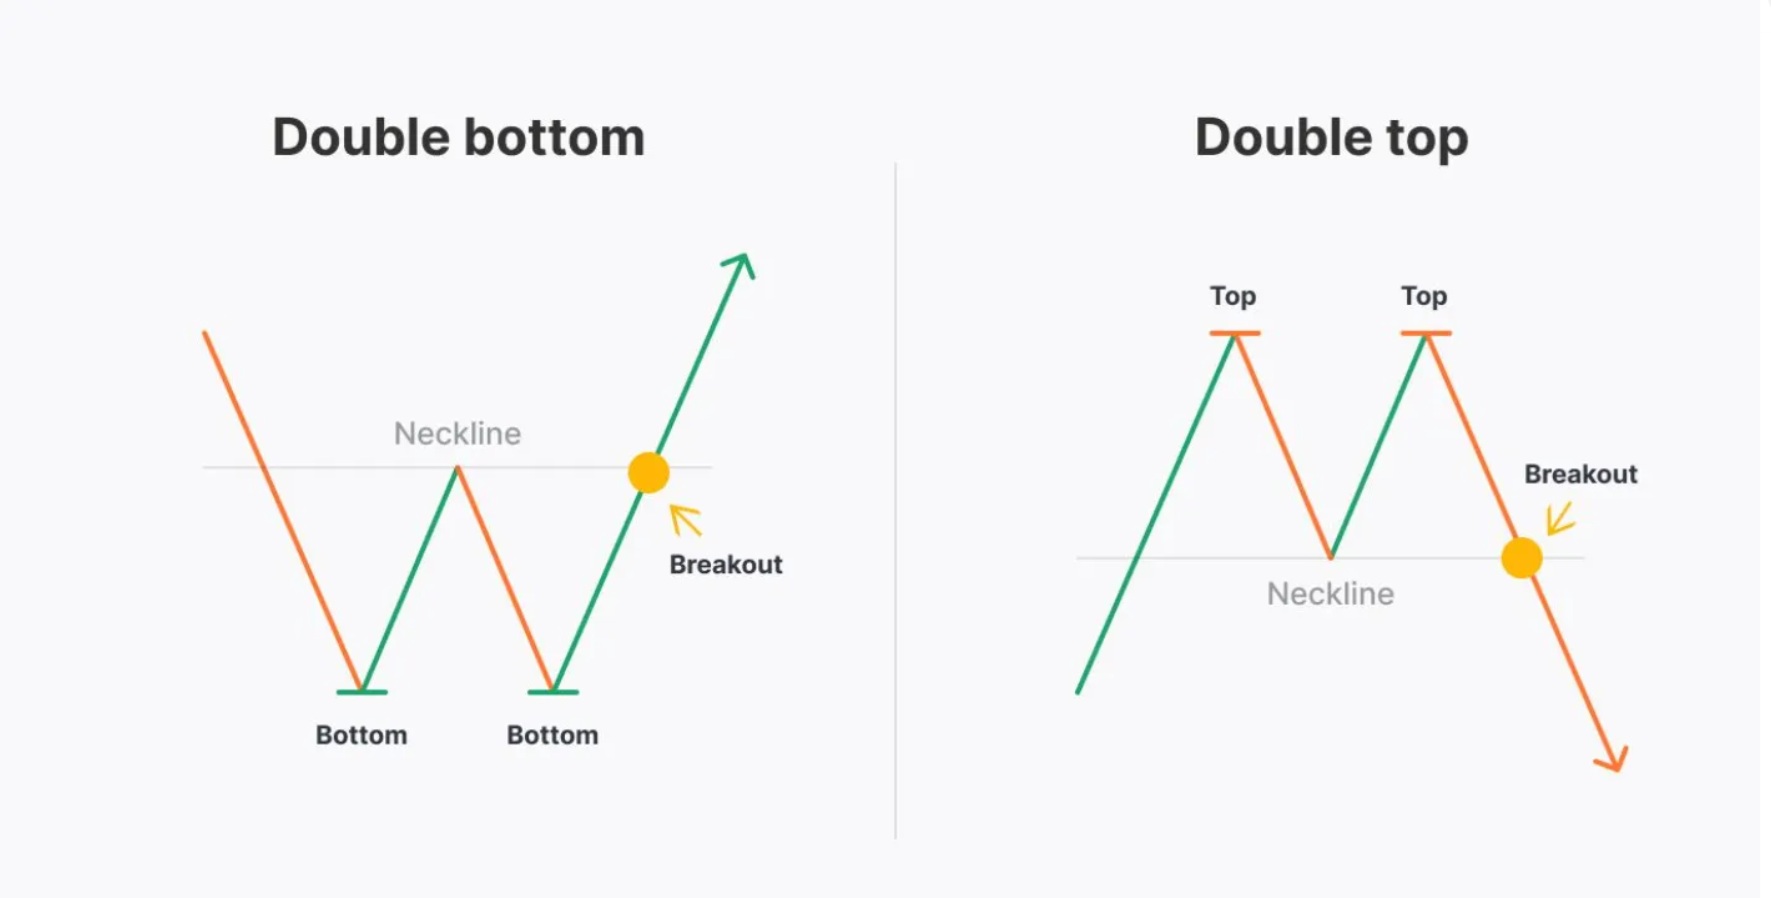
A reversal pattern where price tests a key level twice but fails to break through, indicating exhaustion and a potential trend change.
Now this is not exactly my favorite pattern, I find this pattern kind of, lacking in cryptocurrency especially. But again, it's a very popular pattern, and you could still make a good low time frame scalp out of it most of the time.
Formation Criteria:
- Price reaches an extreme (peak or trough) and reverses
- Price retraces partially toward the previous trend
- Price returns to test the first extreme again, forming a second peak/trough at approximately the same level
- Price fails to break through and begins to move in the opposite direction
- Pattern completes when price breaks the "neckline" (middle trough for double top or middle peak for double bottom)
Trading Strategy:
- Entry: Enter when price breaks the neckline with confirmation (increased volume)
- Stop Loss: Place above/below the second peak/trough
- Take Profit: Measure the height from extreme to neckline and project that distance from the breakpoint
Key Points:
- The more similar in height the two peaks/troughs are, the more reliable the pattern
- Volume typically decreases on the second test, showing weakening momentum
- Stronger when formed after extended trends, indicating exhaustion
- Can sometimes develop into triple tops/bottoms, offering another entry opportunity
3. Engulfing Candle Pattern
Engulfing Candle Pattern
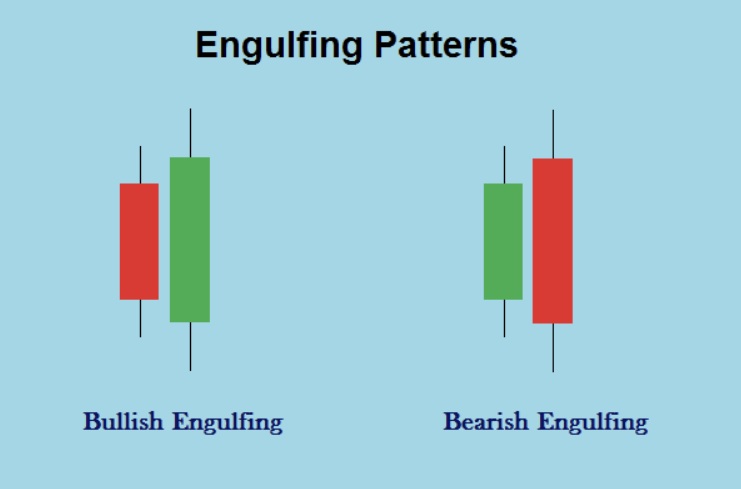
A two-candle reversal pattern where the second candle completely engulfs the body of the first candle, indicating a strong shift in market sentiment.
Formation Criteria:
- First candle is in the direction of the current trend
- Second candle opens beyond the first candle's close and closes beyond the first candle's open
- The body of the second candle completely engulfs the body of the first candle
- The pattern is stronger when the engulfing candle has minimal or no wicks
Trading Strategy:
- Entry: Enter at the open of the candle following the engulfing pattern
- Stop Loss: Place below/above the low/high of the engulfing candle
- Take Profit: Target next significant support/resistance level or use Fibonacci retracement levels
Key Points:
- Most effective when occurring at key support/resistance levels or after extended trends
- The larger the engulfing candle, the stronger the reversal signal
- Higher volume on the engulfing candle increases reliability
- Confirmation with other indicators (RSI divergence, MACD crossover) strengthens the signal
4. Wyckoff Accumulation/Distribution
Wyckoff Accumulation/Distribution
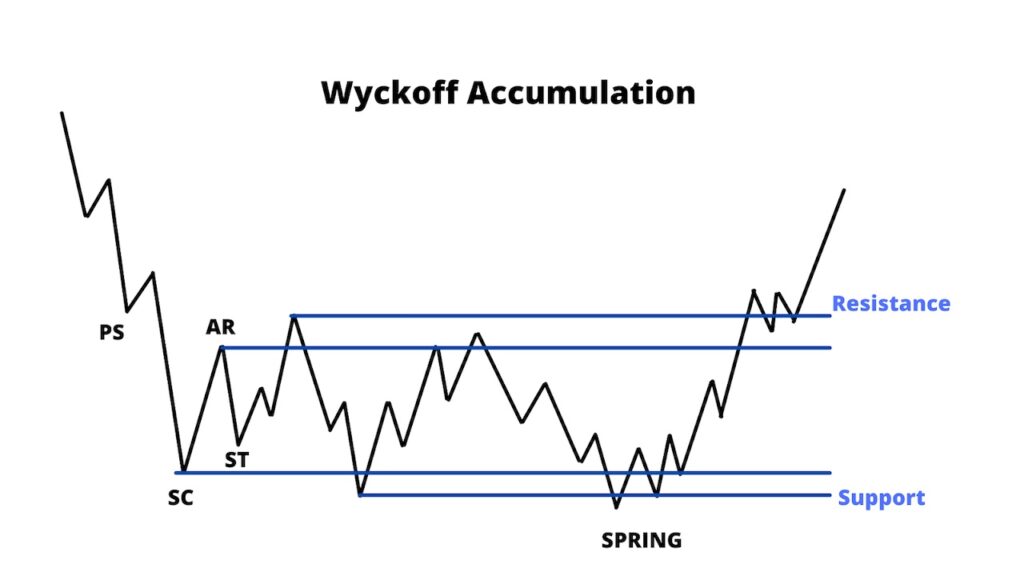
A complex market structure that identifies phases where smart money accumulates or distributes positions before major price movements.
getting more recognition among traders, it's very complex and can only work for HTF (High Time Frame), but identifying this pattern could be the key to a juicy swing position.Formation Criteria (Accumulation):
- Phase A: Downtrend ends with increased volume and price range (selling climax)
- Phase B: Trading range develops with tests of support and resistance (accumulation)
- Phase C: Final spring or test of support that shakes out weak hands
- Phase D: Sign of strength with increased volume and range expansion
- Phase E: Price exits trading range with strong momentum
Trading Strategy:
- Entry: Primary entry after spring in Phase C, secondary entry during Phase E breakout
- Stop Loss: Below the spring low (for accumulation) or above the UTAD (for distribution)
- Take Profit: Project the height of the trading range from the breakout point
Key Points:
- Volume analysis is crucial for confirming each phase
- Look for diminishing volume during tests and increasing volume during breakouts
- Price action should show evidence of absorption (buying on weakness or selling on strength)
- Most effective on higher timeframes (daily and above)
5. Order Block Pattern
Order Block Pattern
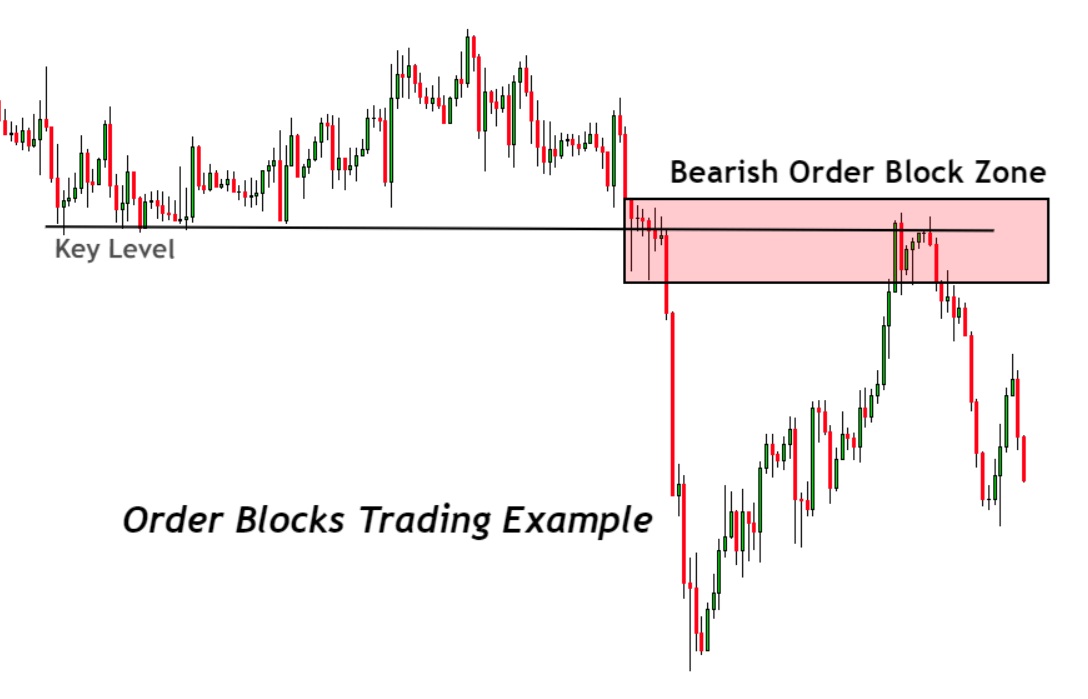
A price area where significant buying or selling occurred before a strong impulse move, often returning to act as support/resistance in the future.
Another favorite, you will notice most cryptocurrency pattern will abide this pattern, suitable for medium time frame as well as scalping.
Formation Criteria:
- Identify the last opposing candle before a strong impulse move (the order block)
- The order block often shows imbalance (large body with minimal wicks)
- Price makes a strong, clean move away from the order block
- Price eventually returns to the order block area after the impulse move
Trading Strategy:
- Entry: Enter when price returns to the order block area and shows reaction (rejection)
- Stop Loss: Place beyond the opposite side of the order block
- Take Profit: Target the previous swing high/low or use Fibonacci extension levels
Key Points:
- The more impulsive the move away from the order block, the stronger its future significance
- Mitigation of the order block often leads to strong continuation in the original direction
- Multiple timeframe confirmation increases reliability
- Often coincides with fair value gaps (FVGs) and market structure breaks